3D Localization for Mars Rover
- Motivation
Robots operating on the surface of Mars or other planets must be able to track their 3D position and attitude precisely. Autonomous localization is a prerequisite for performing meaningful science (e.g., determine the location and distribution of rocks and samples of interest). Furthermore, safe navigation requires that rovers are able to precisely follow the trajectories commanded by an operator on earth. While odometry-based dead-reckoning over rough terrain can be reliable only for short distances, additional information from sensors onboard the rover can be used to extend the time during which a rover can operate autonomously.
- Experimental Results
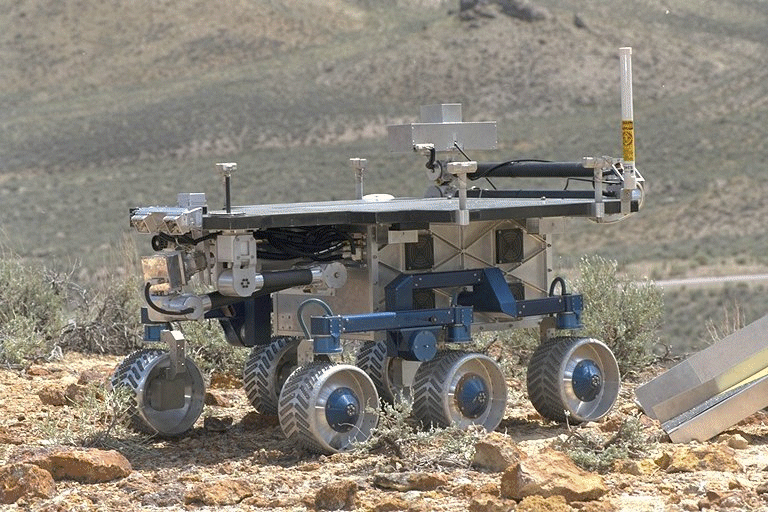
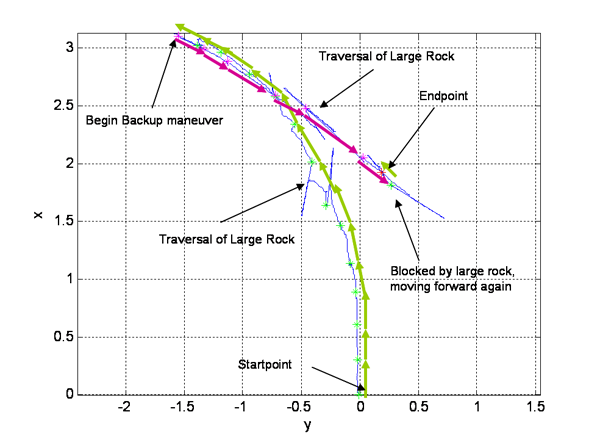
- Figure 1: This shows an example trajectory of about 6 m lengths in the mars yard. The robot was commanded to go straight, but veered to the left after traversing several rocks. Large rocks lead to jerks in the position estimates, which are also reflected in an increasing position uncertainty at these time instances. After the rock has been traversed, the estimate stabilizes. One example is shown shortly before the end, where the robot thinks it has traveled backwards (to the right in the graph) much further than it actually has. A closer look at the y-axis position estimate at that point shows, that immediately after stopping, the estimator corrects this error (i.e., the y-estimate drops sharply from the excessive value of 0.75 m to the realistic estimate of 0.3 m). This correction is made possible by “static updates”, where the robot makes use of the information that it is currently standing still (if so indicated by measurements from odometry and IMU). Note that towards the end of the trajectory, the robot's wheels become more and more “uncalibrated” (that is, they are pointing in different directions even though commanded to be straight), leading to a noticeable, growing discrepancy between commanded and executed motion. (The robot actually failed when attempting to execute the “calibrate wheels”-command to reset their orientation at the endpoint of the shown trajectory).
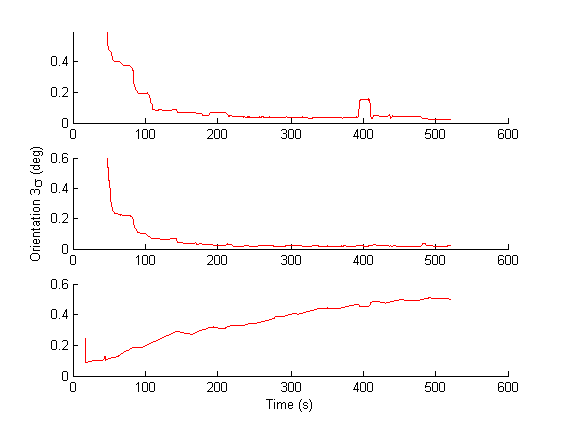
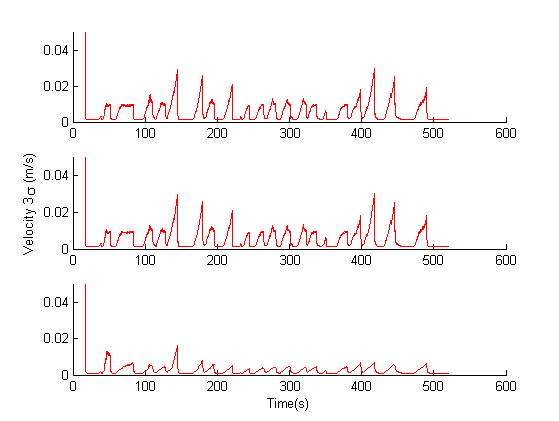
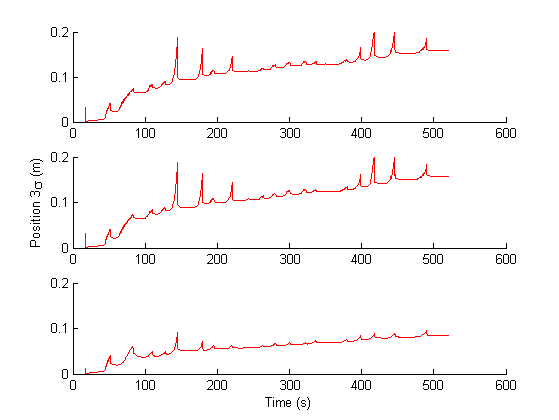
- Figures 2, 3, and 4: These three figures show the 3-sigma bounds for the attitude, velocity and position estimate. This is an indicator for the estimator's performance, showing, for example, that the position is known to within +/- 18 cm after 500 sec (99.7 percentile).Note that the velocity estimate is bounded. Also the spikes correspond to periods of motion, the larger spikes to the traversal of rocks.
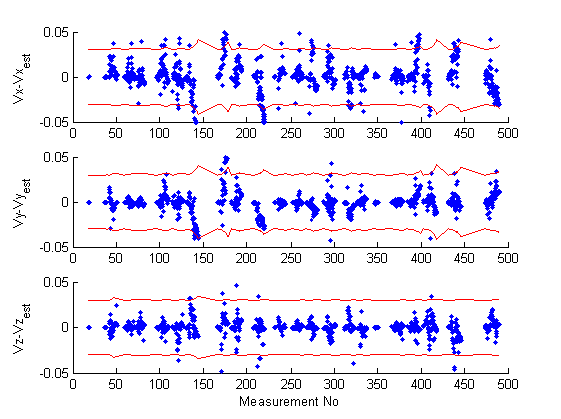
- Figure 5: The velocity residuals (red dots) and the 3-sigma bounds (blue lines) computed based on the residual covariance during each velocity update. Note that the residuals are within their corresponding 3-sigma bounds, indicating a consistent estimator.